(Click on the figure to get a bigger version)
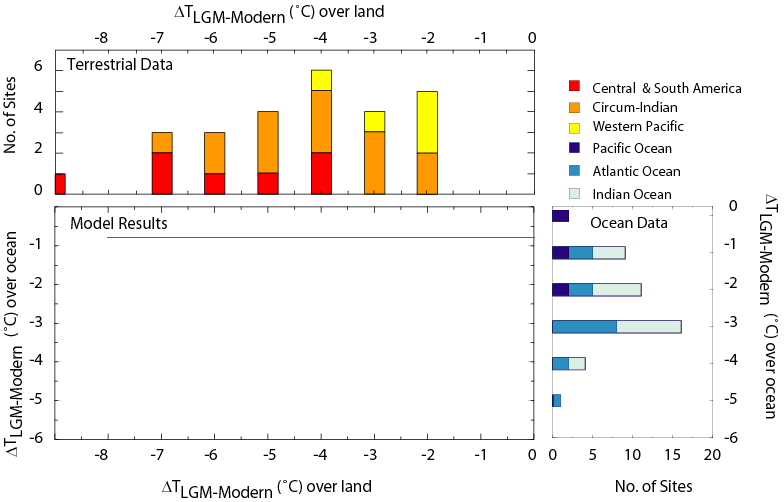
The LGM Tropical Terrestrial Data Synthesis was used as a diagnostic by Pinot et al. (1999) and in the IPCC (2001). An updated version of this diagram was presented by Harrison (2000). In this diagram, the uppermost histogram shows the frequency of reconstructed temperature changes, based on terrestrial data, at the elevation of the individual sites colour-coded by region (Central and South America, circum-Indian, Western Pacific). The histogram at the right shows the frequency of reconstructed sea-surface temperature changes, based on alkenone data from the TEMPUS data set (Rosell-Melé et al., 1998), colour-coded by ocean basin (Pacific, Atlantic, Indian). To use this graphic for diagnostic purposes, the simulated change in temperature over land and ocean should be plotted. This could be the zonal mean, or regional averages for the land areas/ocean basins distinguished for the observations. The line drawn on the graph represents the zonal mean sea-surface temperature calculated from the CLIMAP (1981) gridded data set, for comparison.
(Click on the figure to get a bigger version)
| Full size image (27 Kb) |
| pdf file (66 Kb) |
| Data file - zipped Excel file (2 Kb) |
| Data file - gzipped tab-separated text file (1 Kb) |
| Data file - gzipped semicolon-separated text file (1 Kb) |
If you wish to use this diagram for diagnostic purposes, you should cite Harrison (2000) as the source. Technical queries about the data sets should be addressed to Sandy Harrison or Mark Creighton. The Tropical Climates Dataset initiative received funding support from IGBP-GAIM, the U.S. National Science Foundation, the European Community, and the Swedish Natural Science Research Council (NFR).